|
By clicking a button on the page, an applet will pop-up showing the data. The applet
uses JMathPlot and
give you the following controls on the data visualization.
|
|
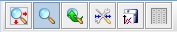 Graph controls Graph controls
 Center axes Center axes- Allow to shift the graph by dragging the mouse with the left
button pressed.
 Zoom Zoom- Allow to zoom an area of the graph. You can select the area
dragging the mouse with the left button pressed.
 Reset zoom & axes Reset zoom & axes- Select the default view.
 Set scales Set scales- Show the axis control window.
 Save graphics in a .png file Save graphics in a .png file- It is disabled. An applet cannot write on your local file system.
 Get datas Get datas- Show the data window. From this window it is possible to
see and copy the numerical data to the clipboard.
Simply select the data dragging the mouse with the
left button pressed, then press Ctrl - C.
The Copy and Save buttons are disabled, because
an applet can write directly on your system only if
it is signed (it will be come as soon as possible).
|
|
Mouse controls
- Mouse right button:
- If you click it on the graph, the data value at cursor position
is shown.
|